
AI-Powered PowerPoint Plugin for Data Storytelling

-
Industries
- Business Software & Productivity
-
Company
Our client is an author and data storytelling expert whose book on presenting data with charts became the foundation for this product.
The product is a free PowerPoint add-in for Windows and Mac that helps users turn data into clear, presentation-ready visuals. Users can insert quantitative charts and qualitative diagrams, refine slide text with generative AI tools, and check the logic of their story with the author’s Vertical and Horizontal Logic approach. A companion website introduces the plugin, handles free downloads, and brings together support, video tutorials, a blog, and feature requests. -
What We Did
We designed a complete product from the ground up - a website and a PowerPoint plugin that work together as one ecosystem. The website introduces the product, explains its value, and gives users free access to the plugin through a newsletter subscription. It also serves as a hub for downloads, support, and new feature suggestions.
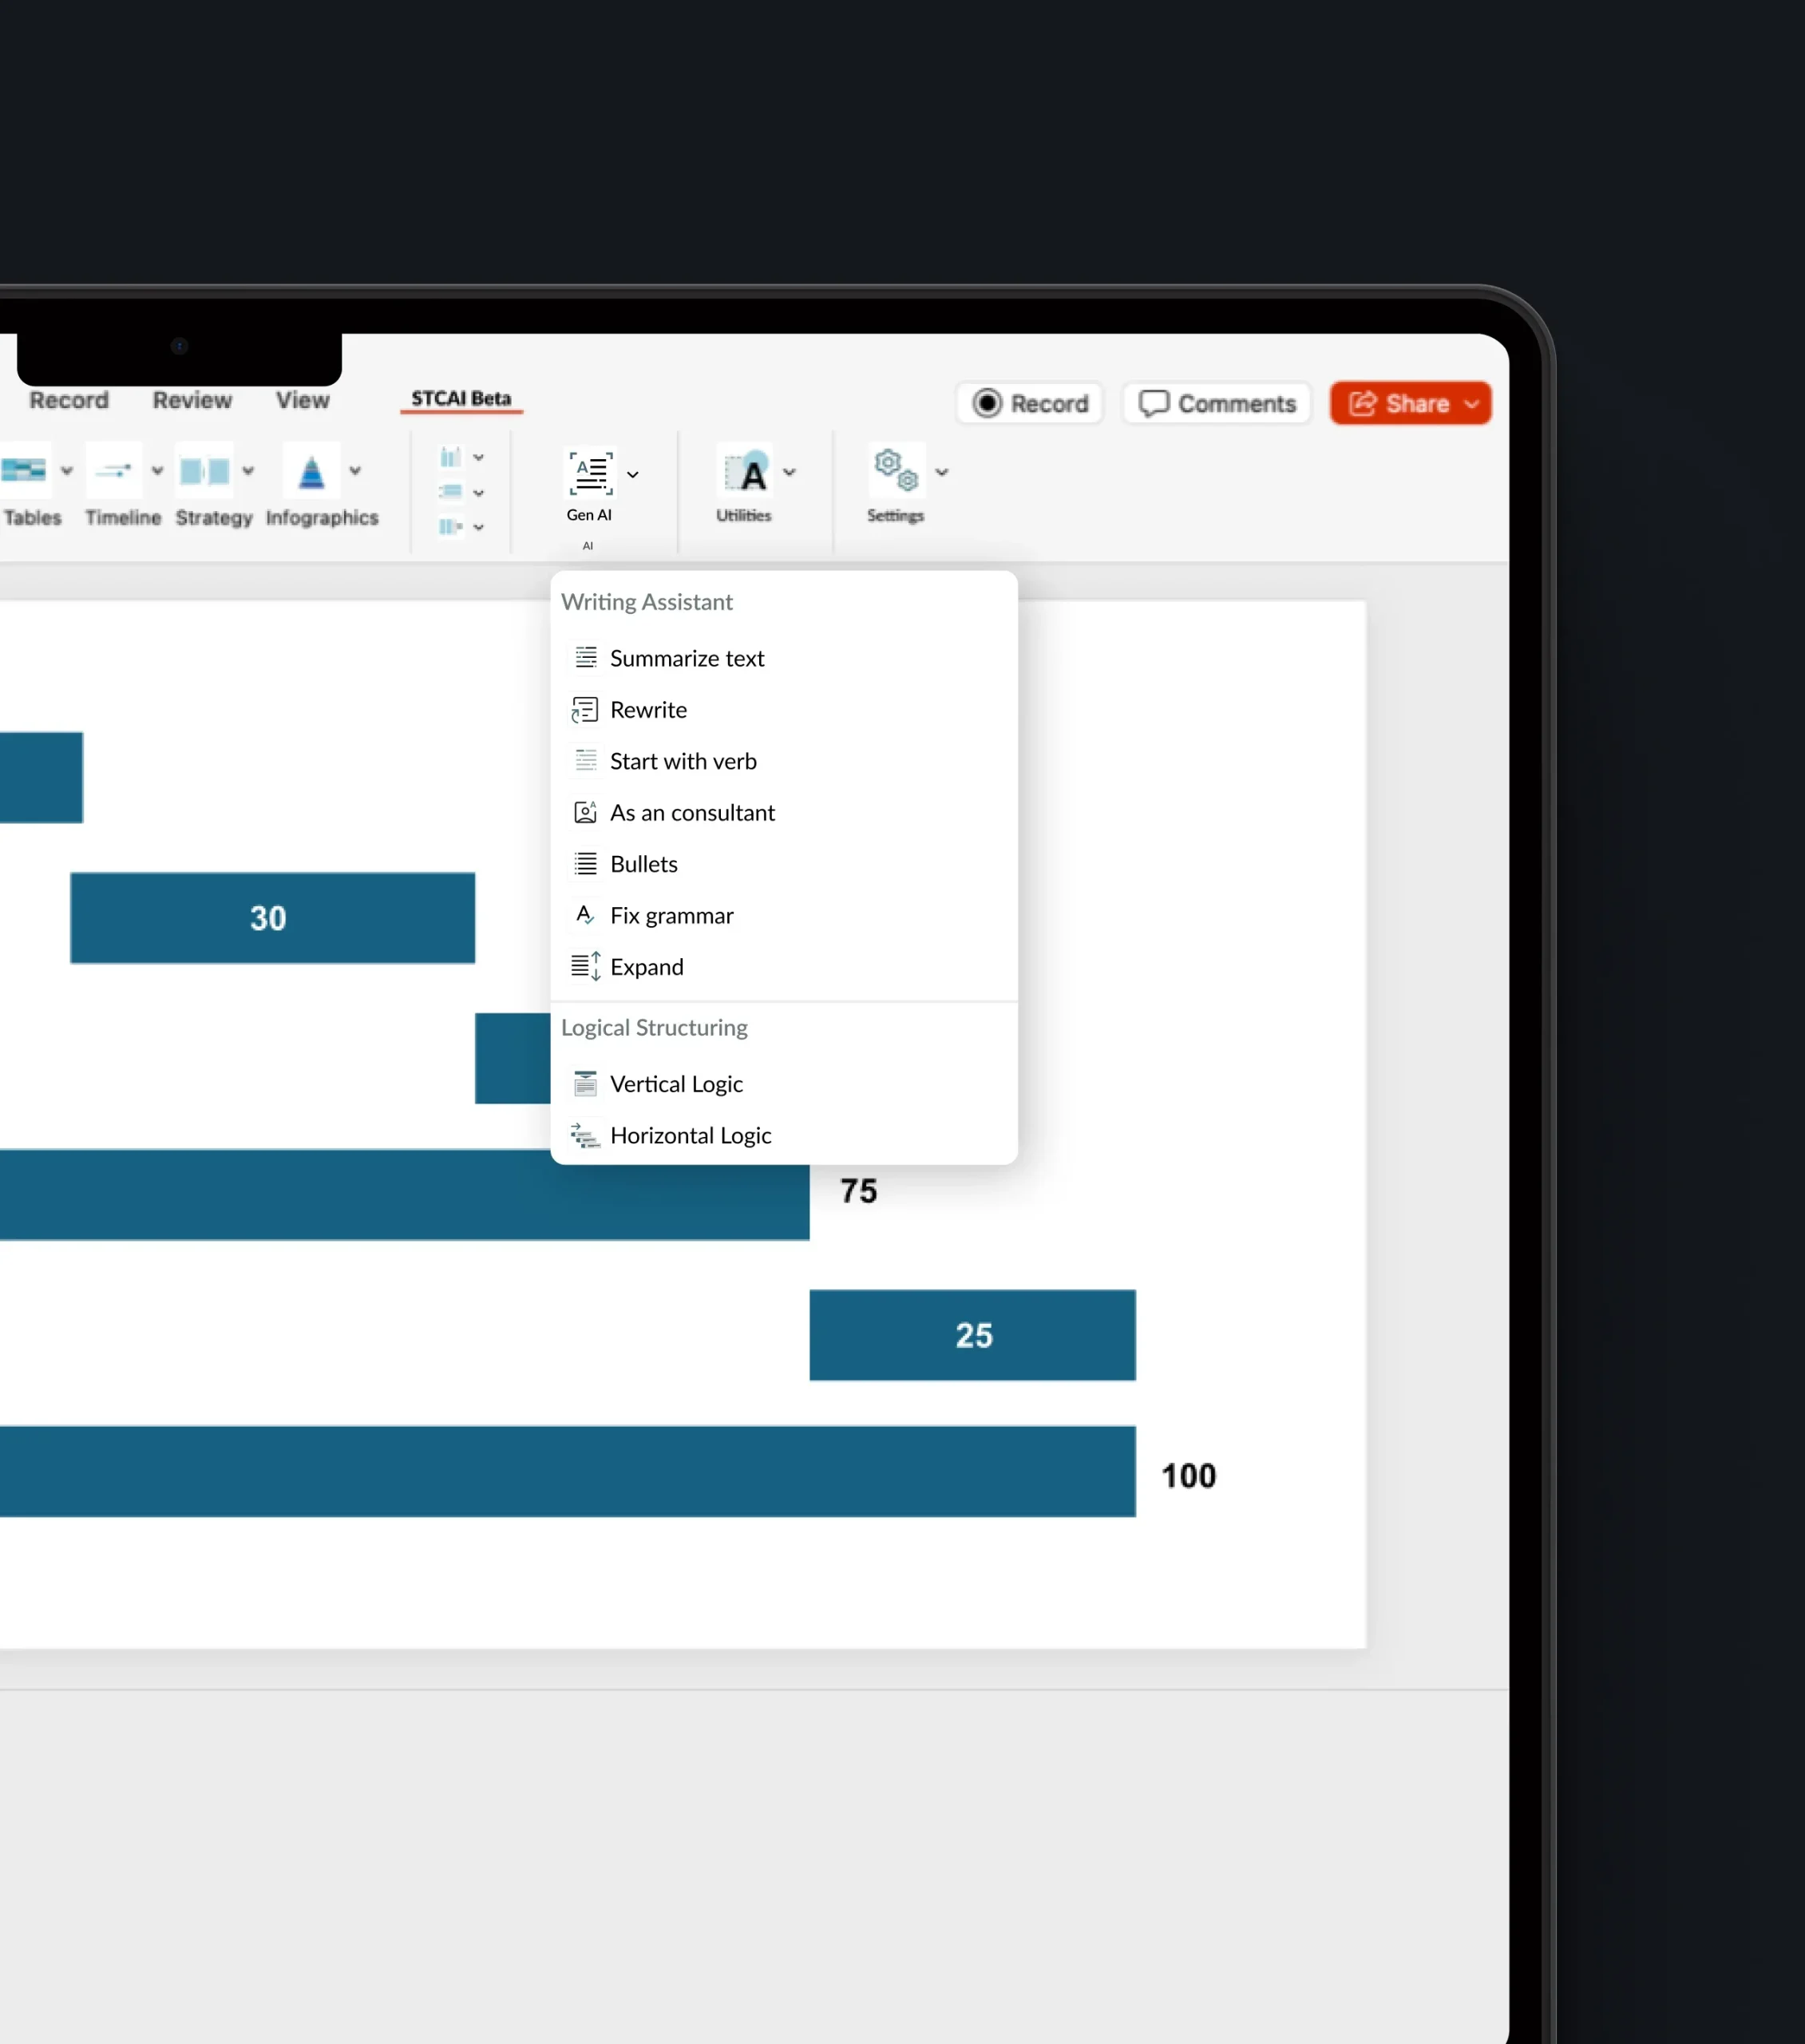
The plugin extends PowerPoint with advanced charting options and AI-powered text tools. Based on the author’s book, it offers both quantitative and qualitative charts, AI features for expanding, correcting, and summarizing text, and unique Vertical and Horizontal Logic tools for cohesive storytelling. It works on both Mac and Windows, making it easy for anyone to create engaging, professional presentations.
Challenges
-
01
Presenting a Free Product With Clear Value
The website needed to explain what the plugin does and why it is worth installing, even though it is free. The challenge was to build trust and lead visitors to the download in just a few steps, while keeping the message simple and focused.
-
02
Making Getting Started Effortless
Getting the plugin involves several steps - signing up, receiving a license key by email, and installing it on Mac or Windows. The experience needed to guide users through each step clearly, so no one gets lost between the website, their inbox, and PowerPoint.
-
03
Turning a Storytelling Method Into a Tool
The plugin is built on the author’s approach to presenting data. The design needed to translate these principles into simple features that feel native to PowerPoint, giving quick access to a large library of charts and AI tools without overwhelming users.
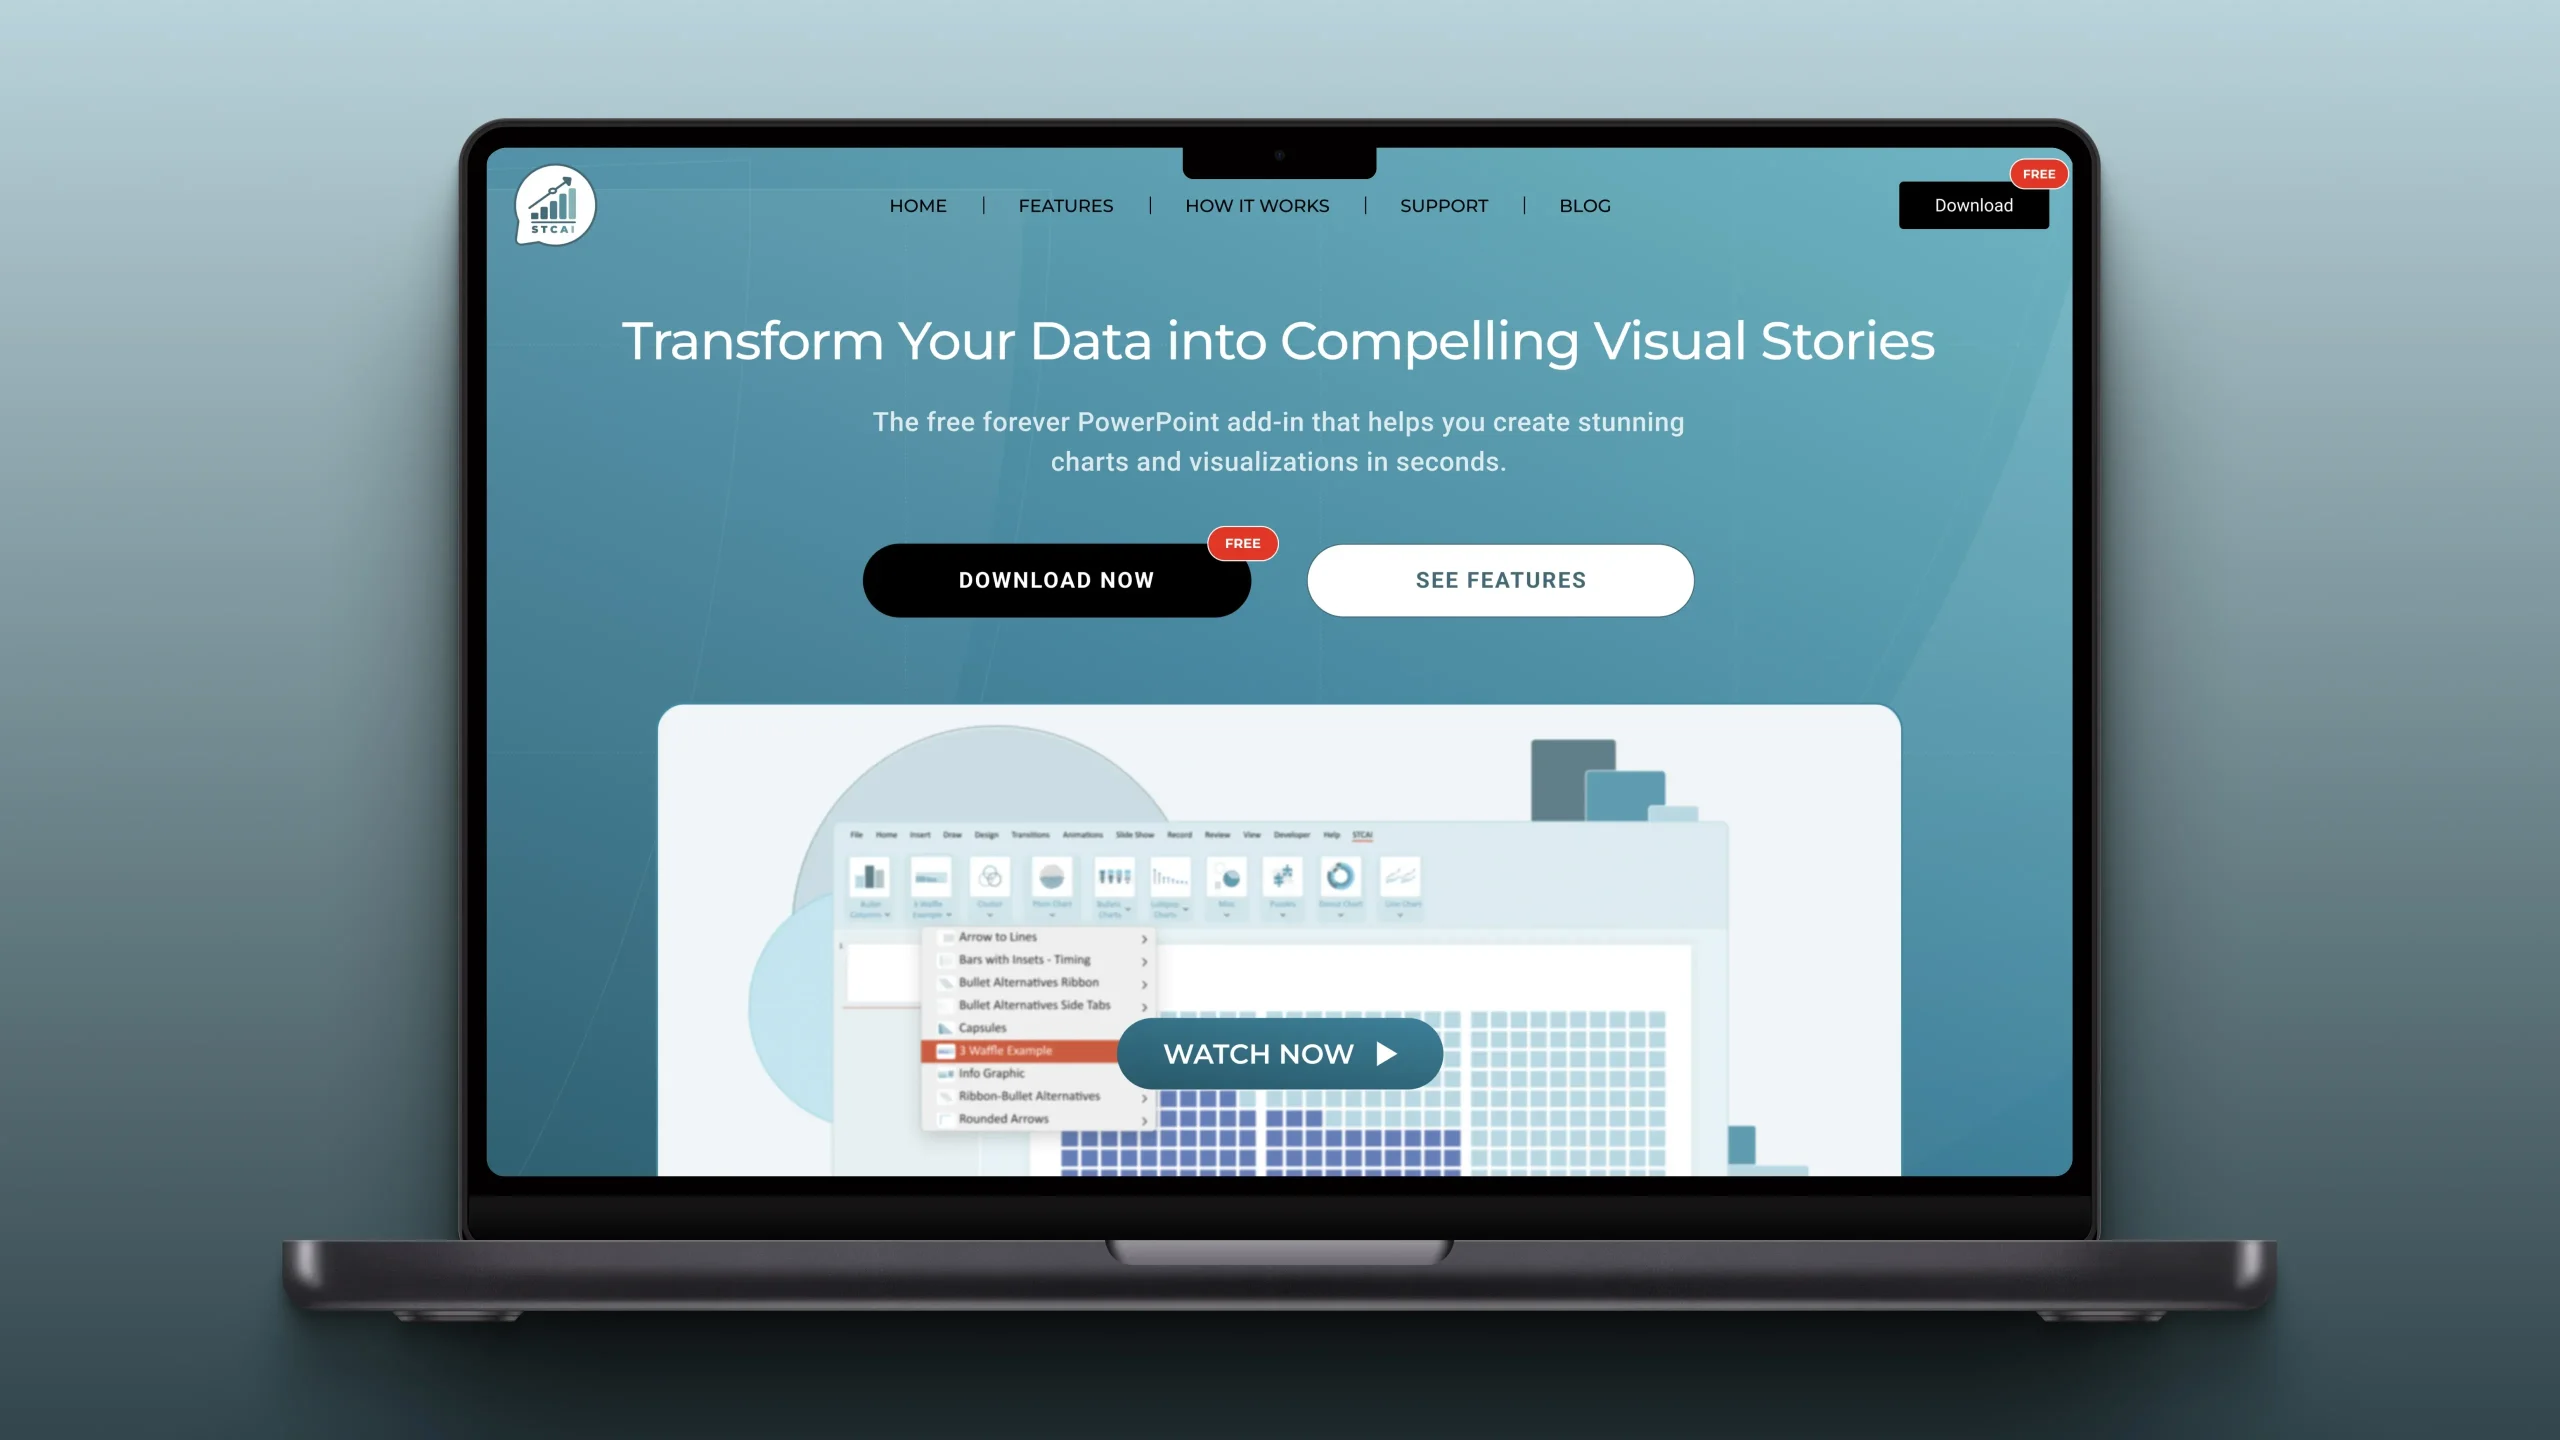
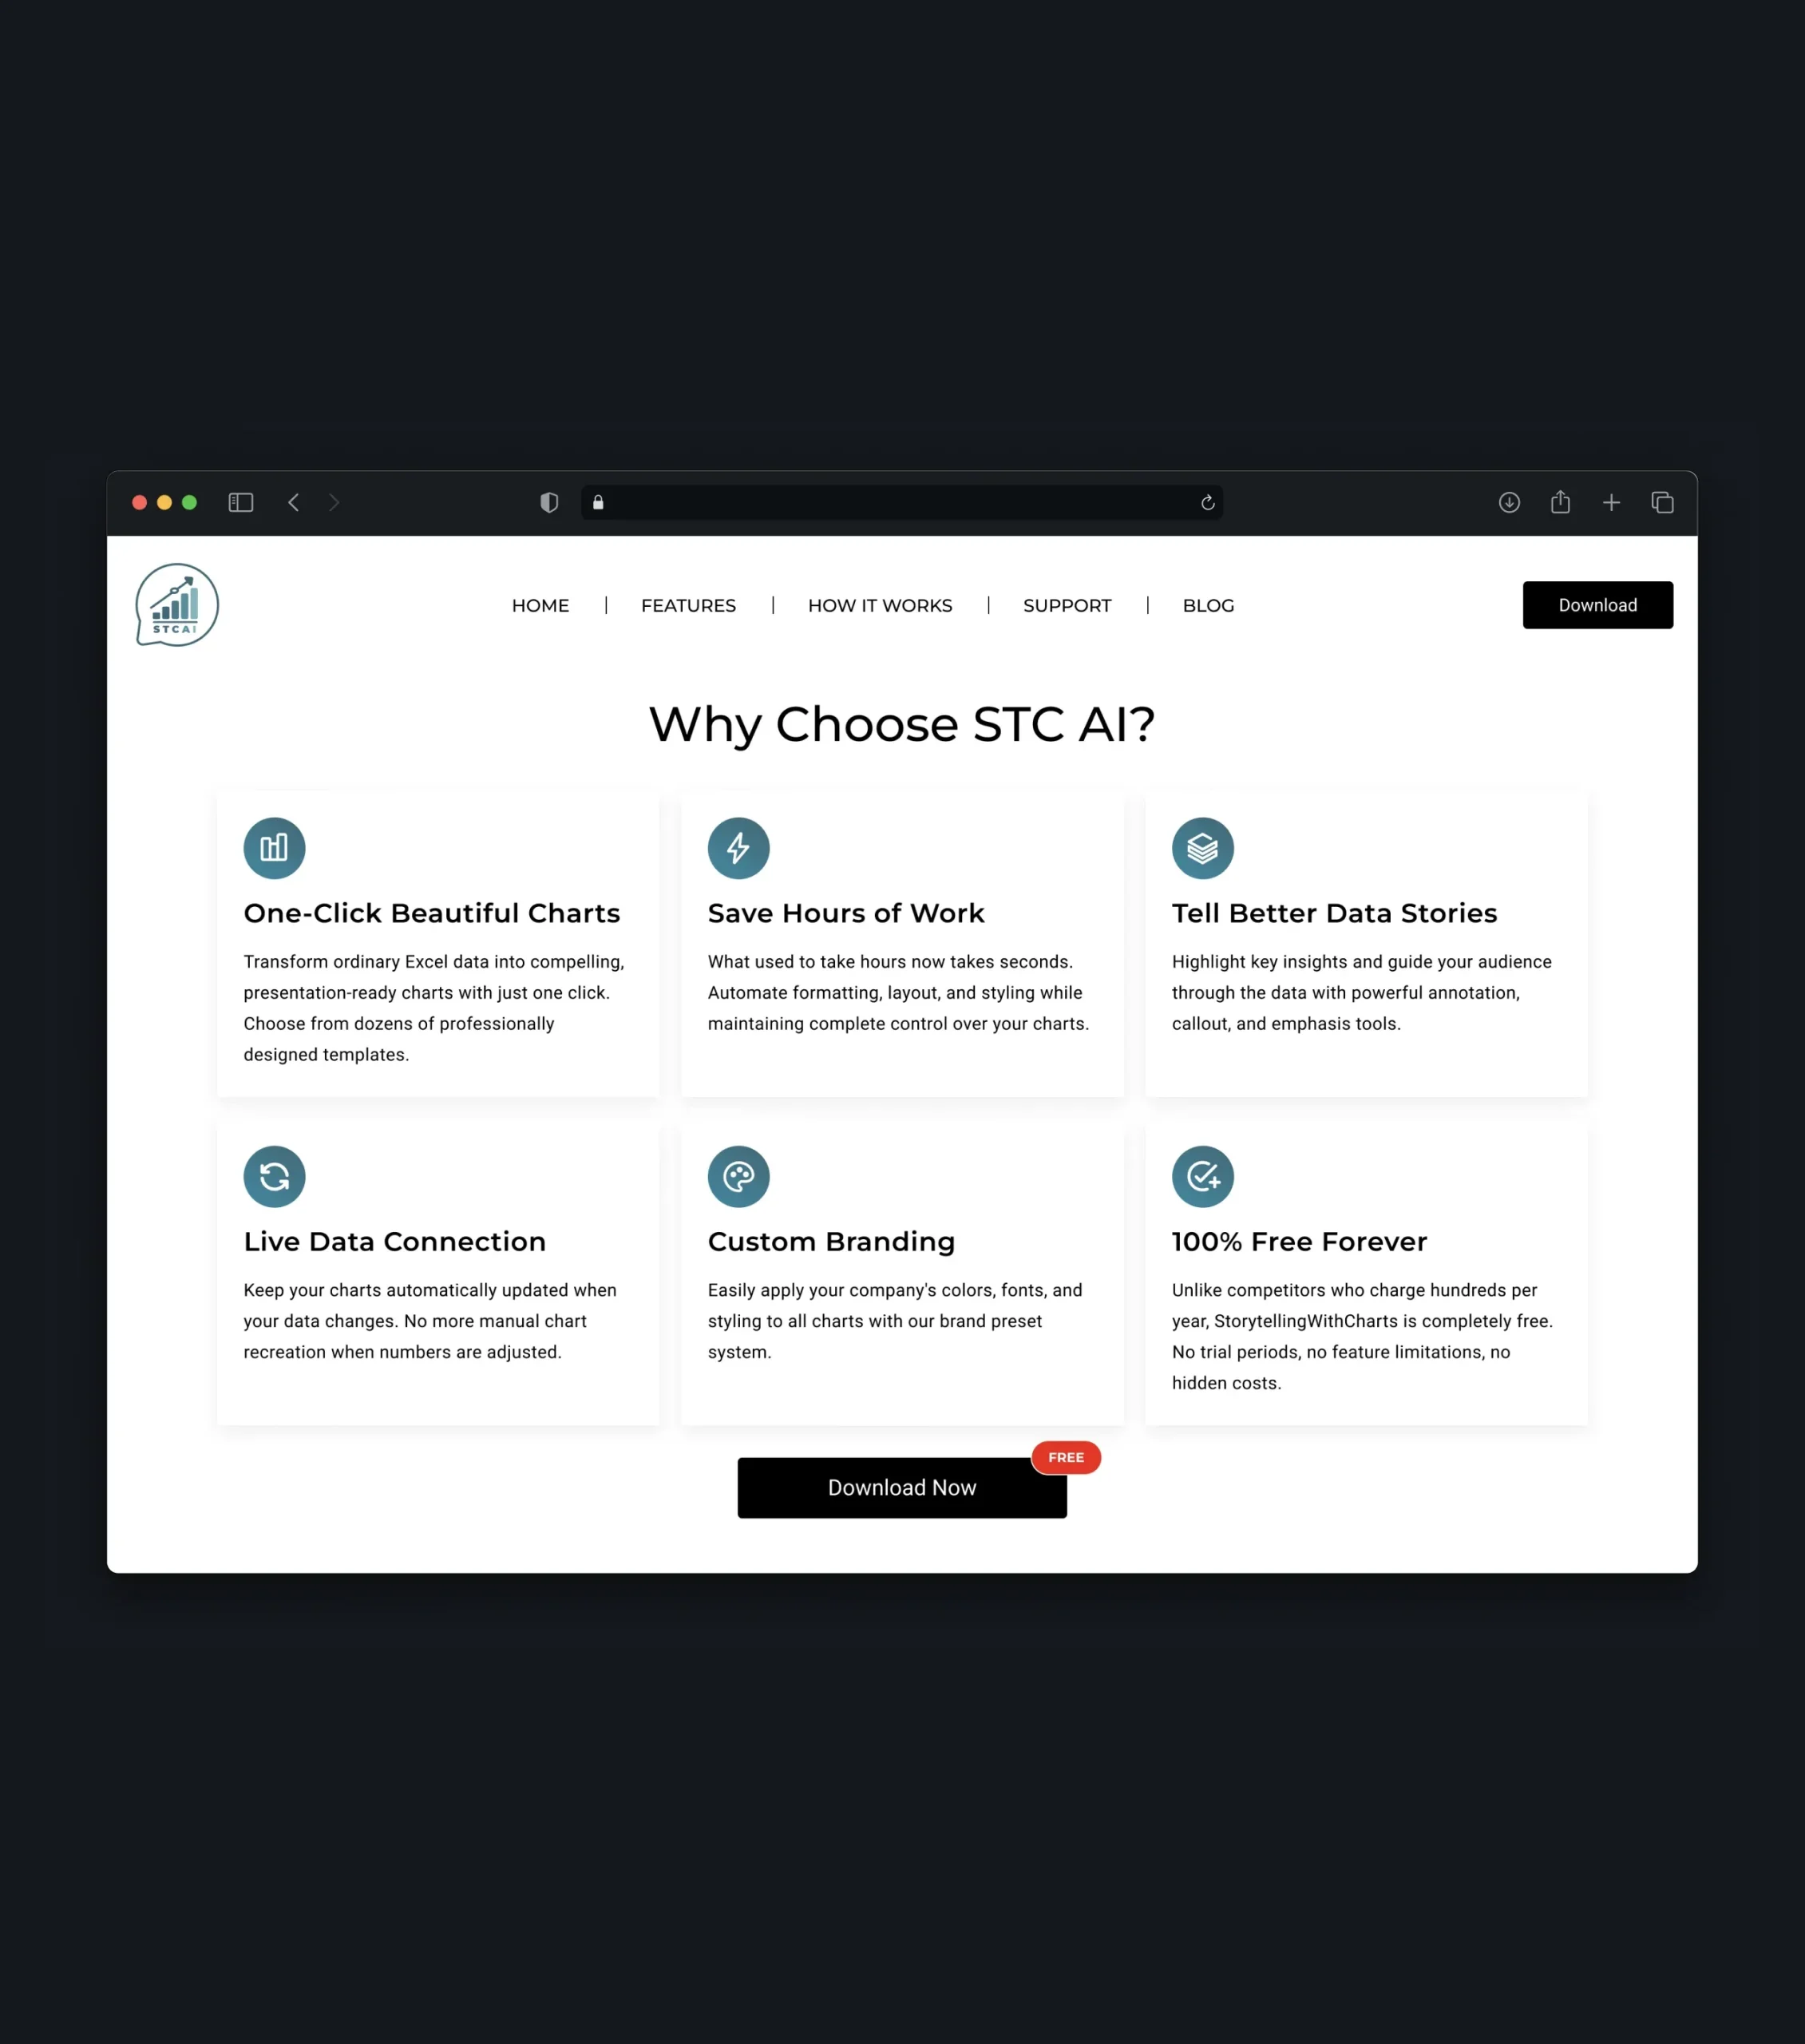
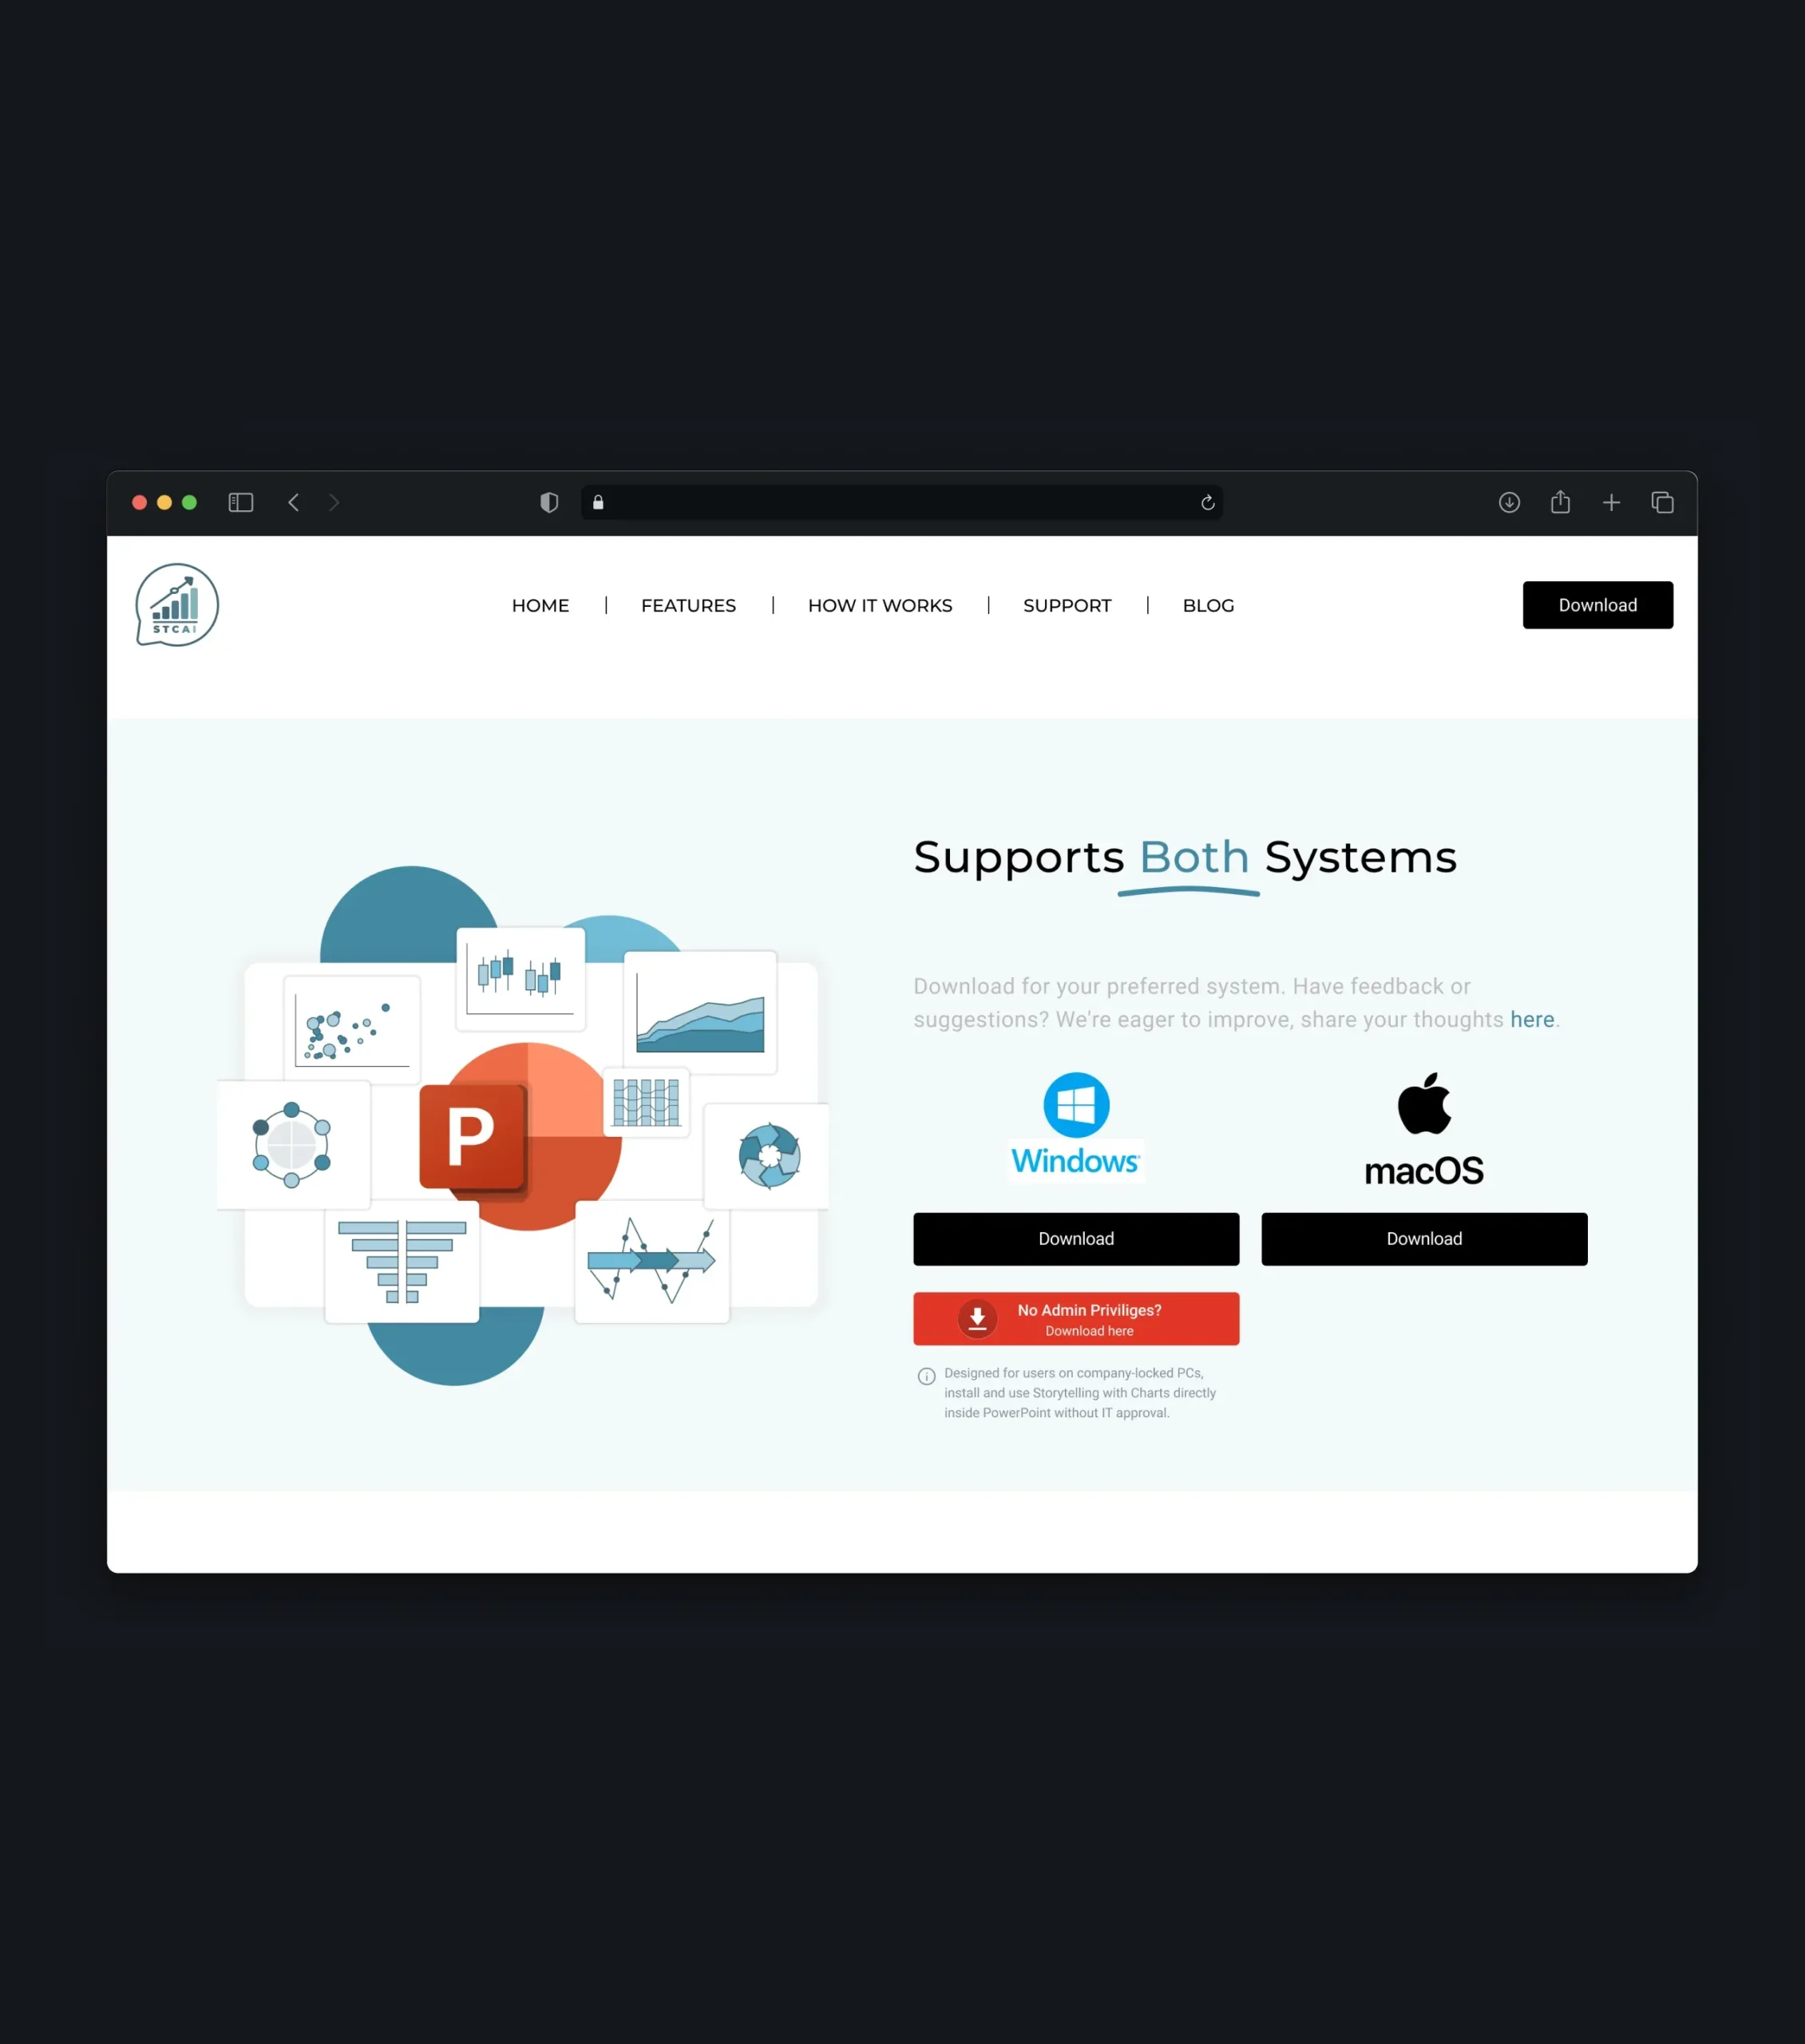
Value-Focused Home Page
The website clearly presents the plugin’s key benefits, from creating professional charts to saving time and improving data storytelling. Dedicated download options for Windows and macOS make it easy for users to choose the right version and get started.
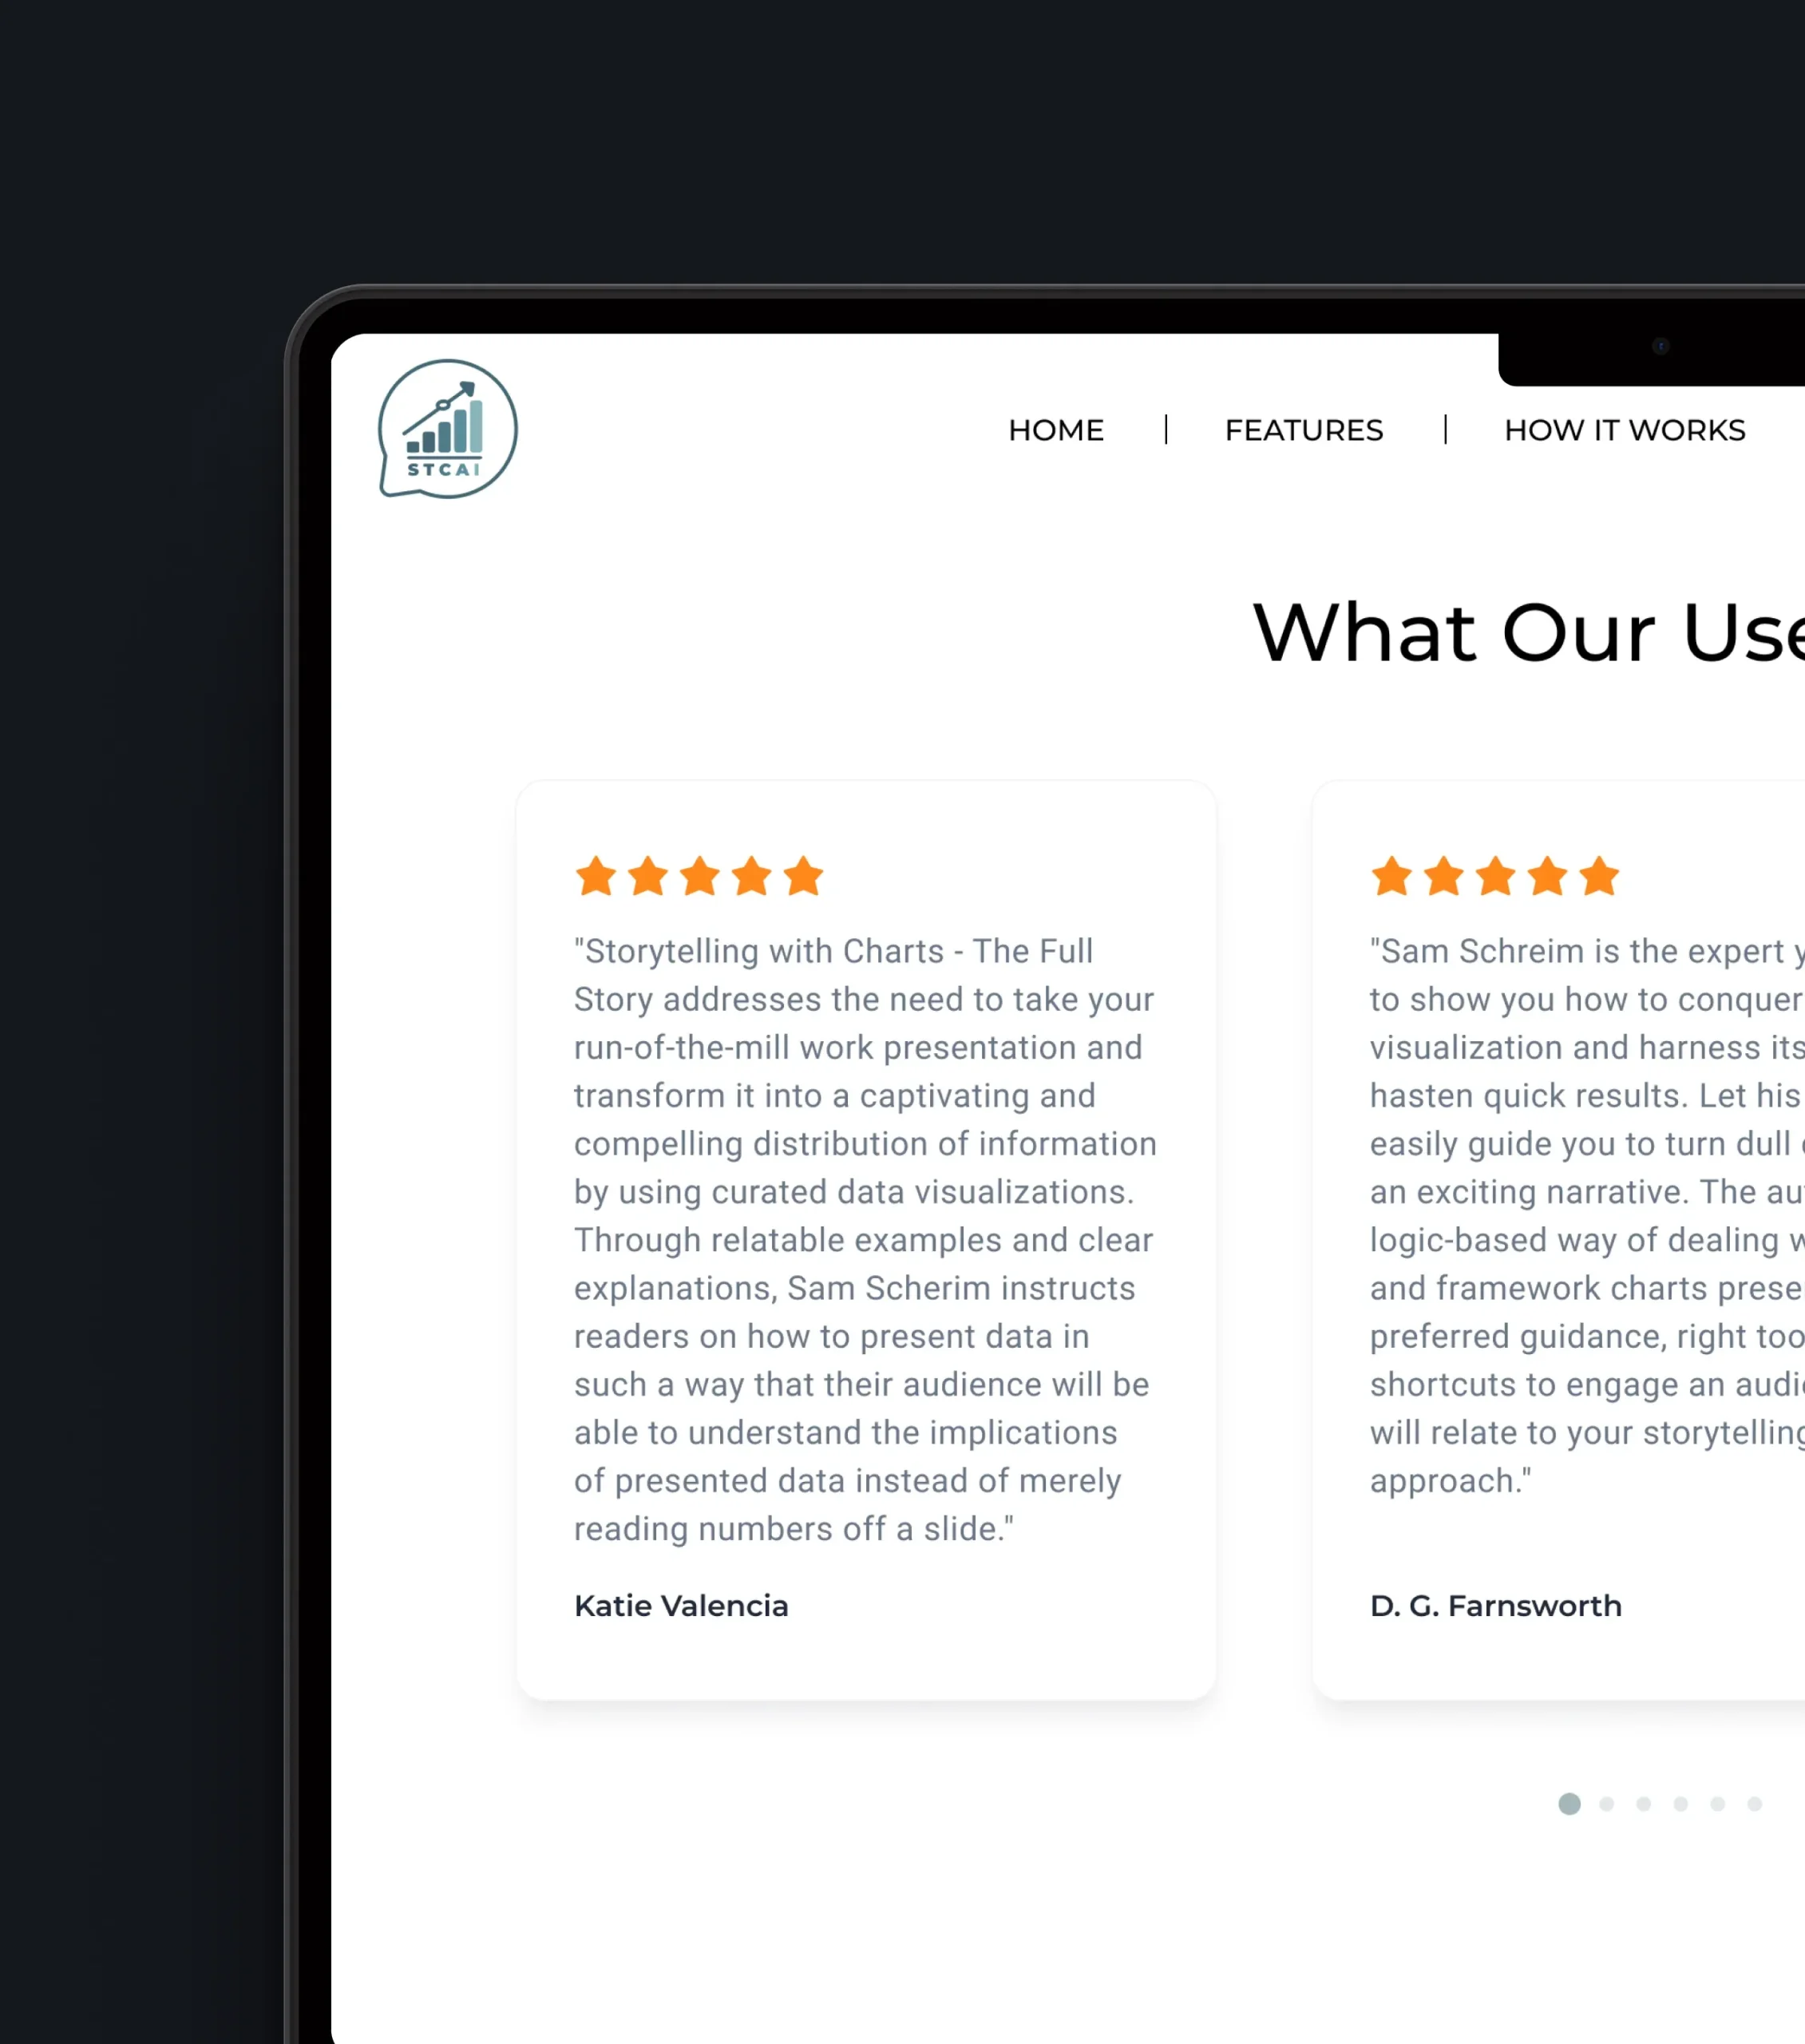
Trust & Expertise
Real user feedback and a dedicated section about the author’s book show the expertise behind the product. Together, they build trust and connect the plugin to a proven approach to presenting data.

Guided Download Flow
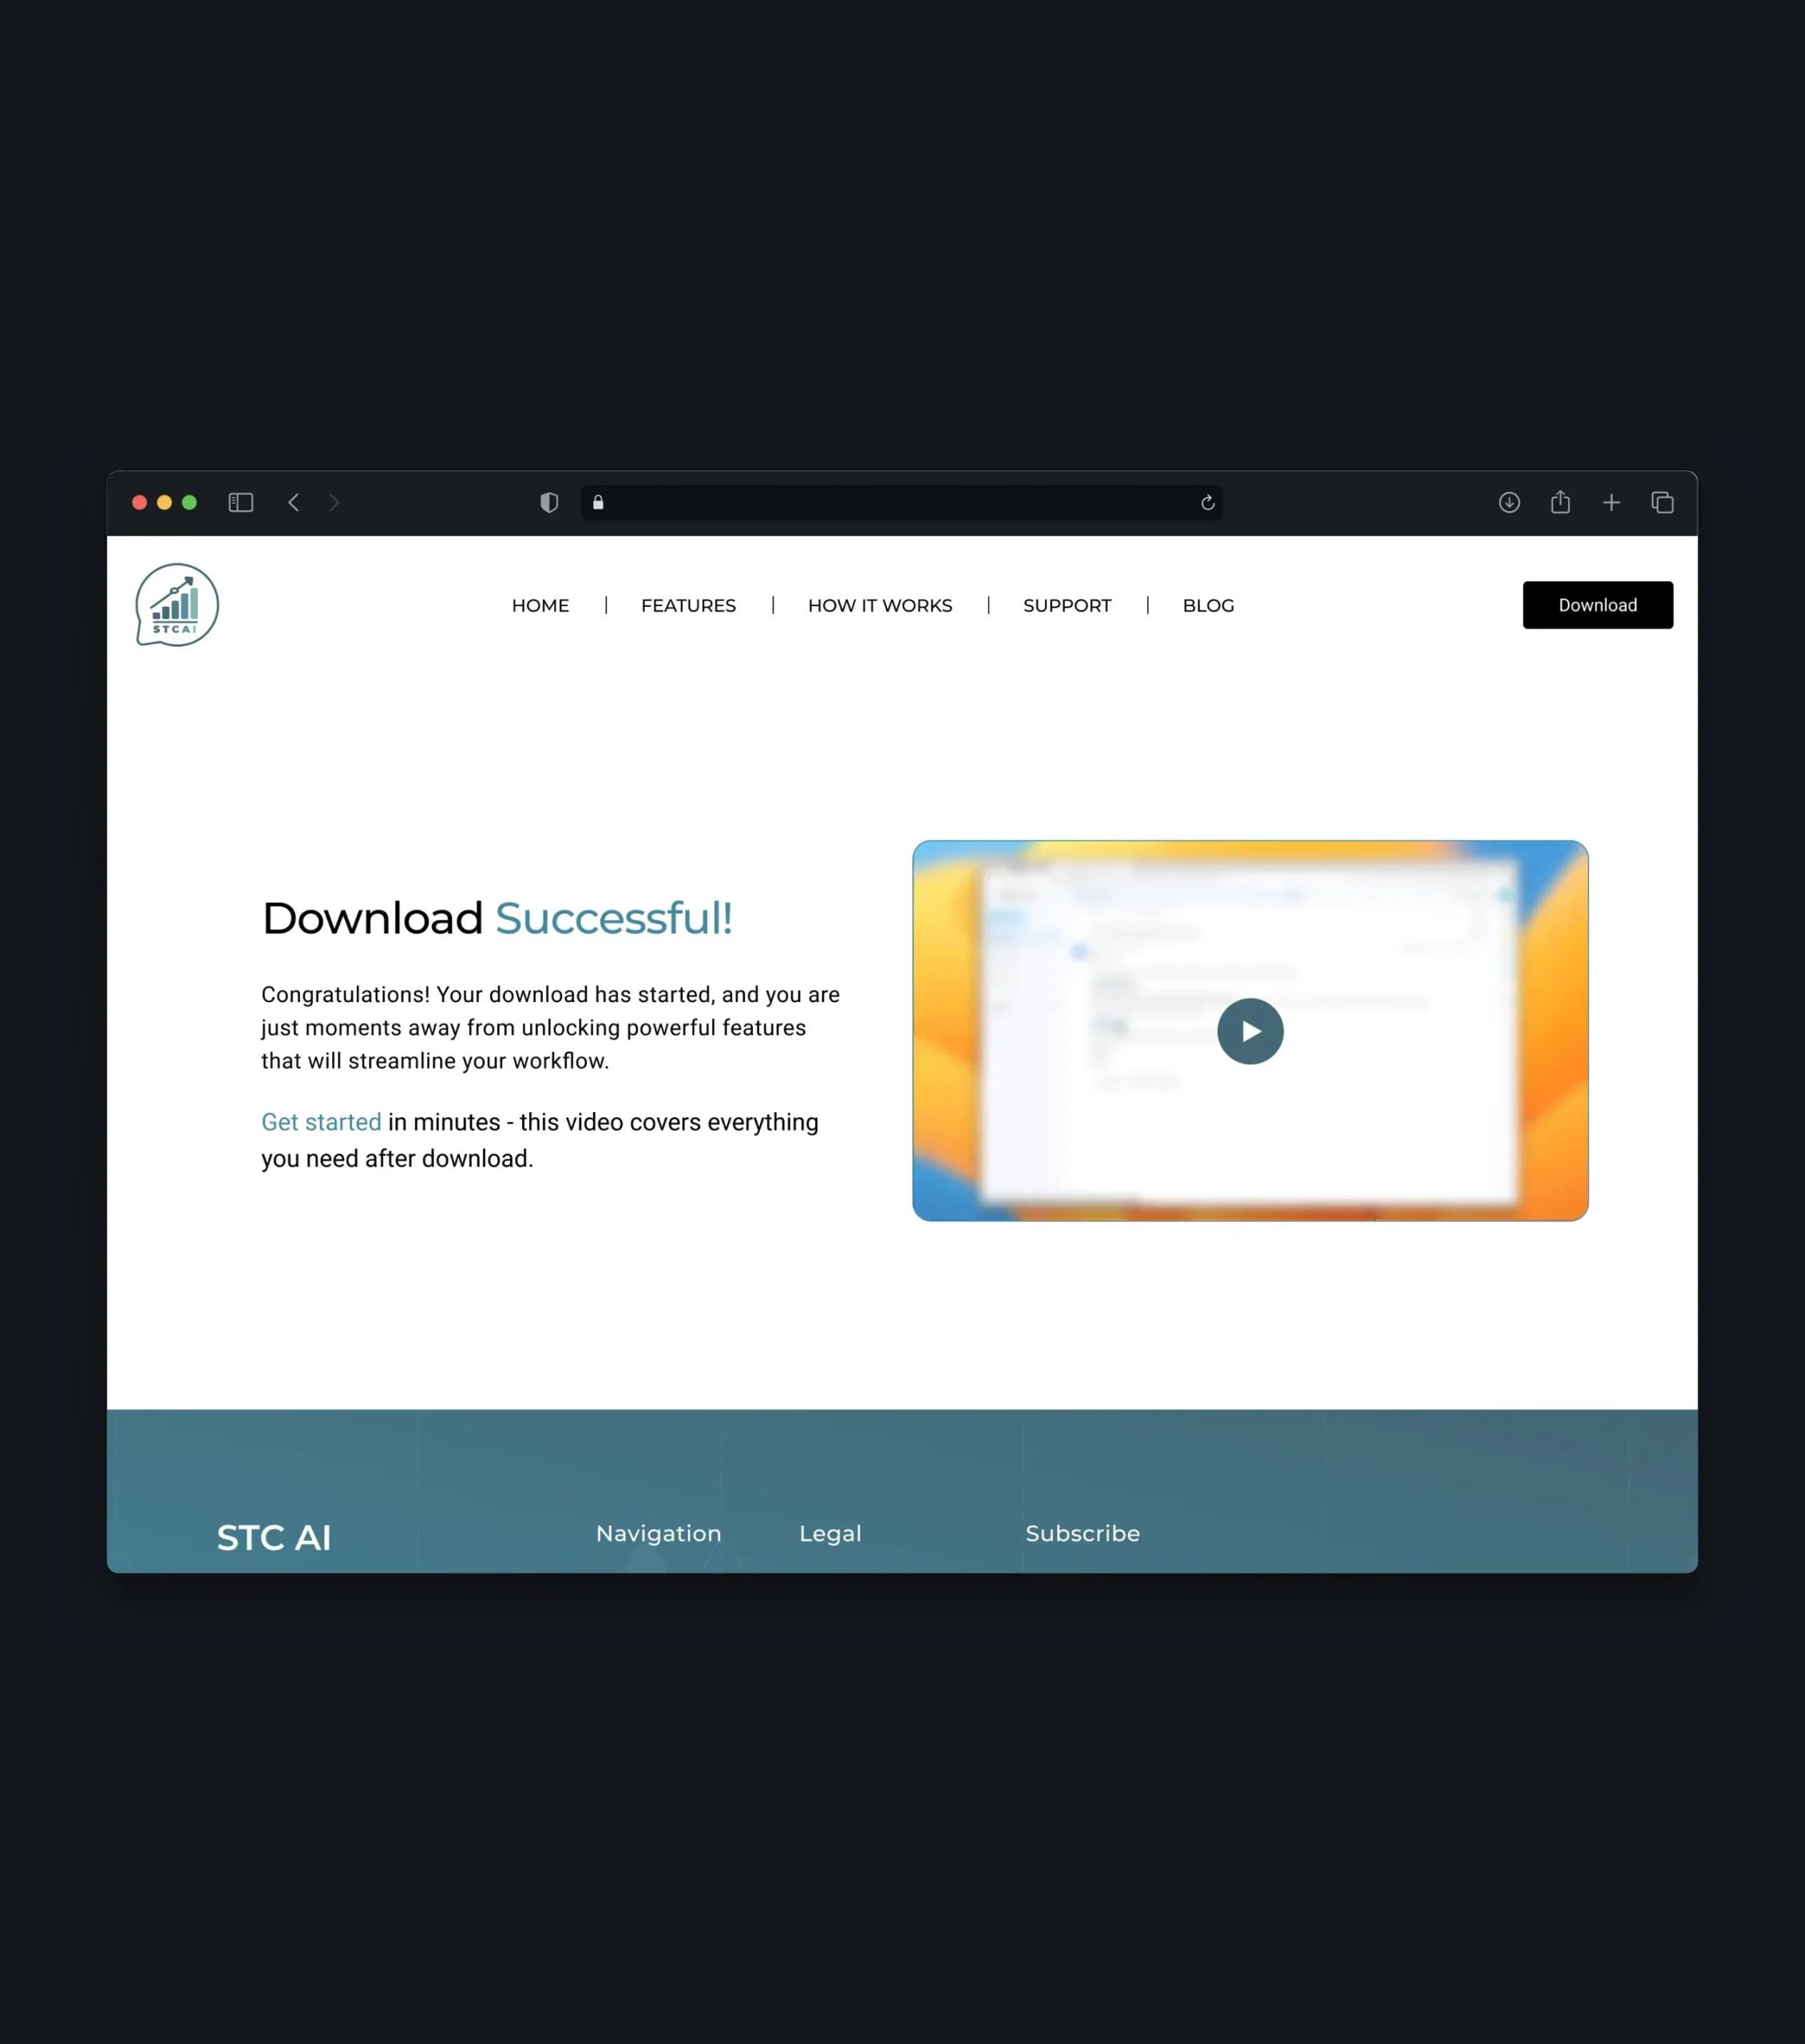
After sign-up, clear confirmation pages guide users through the download and installation process, including instructions for receiving their license key by email. A short onboarding video helps users complete the setup and start using the PowerPoint add-in with confidence.

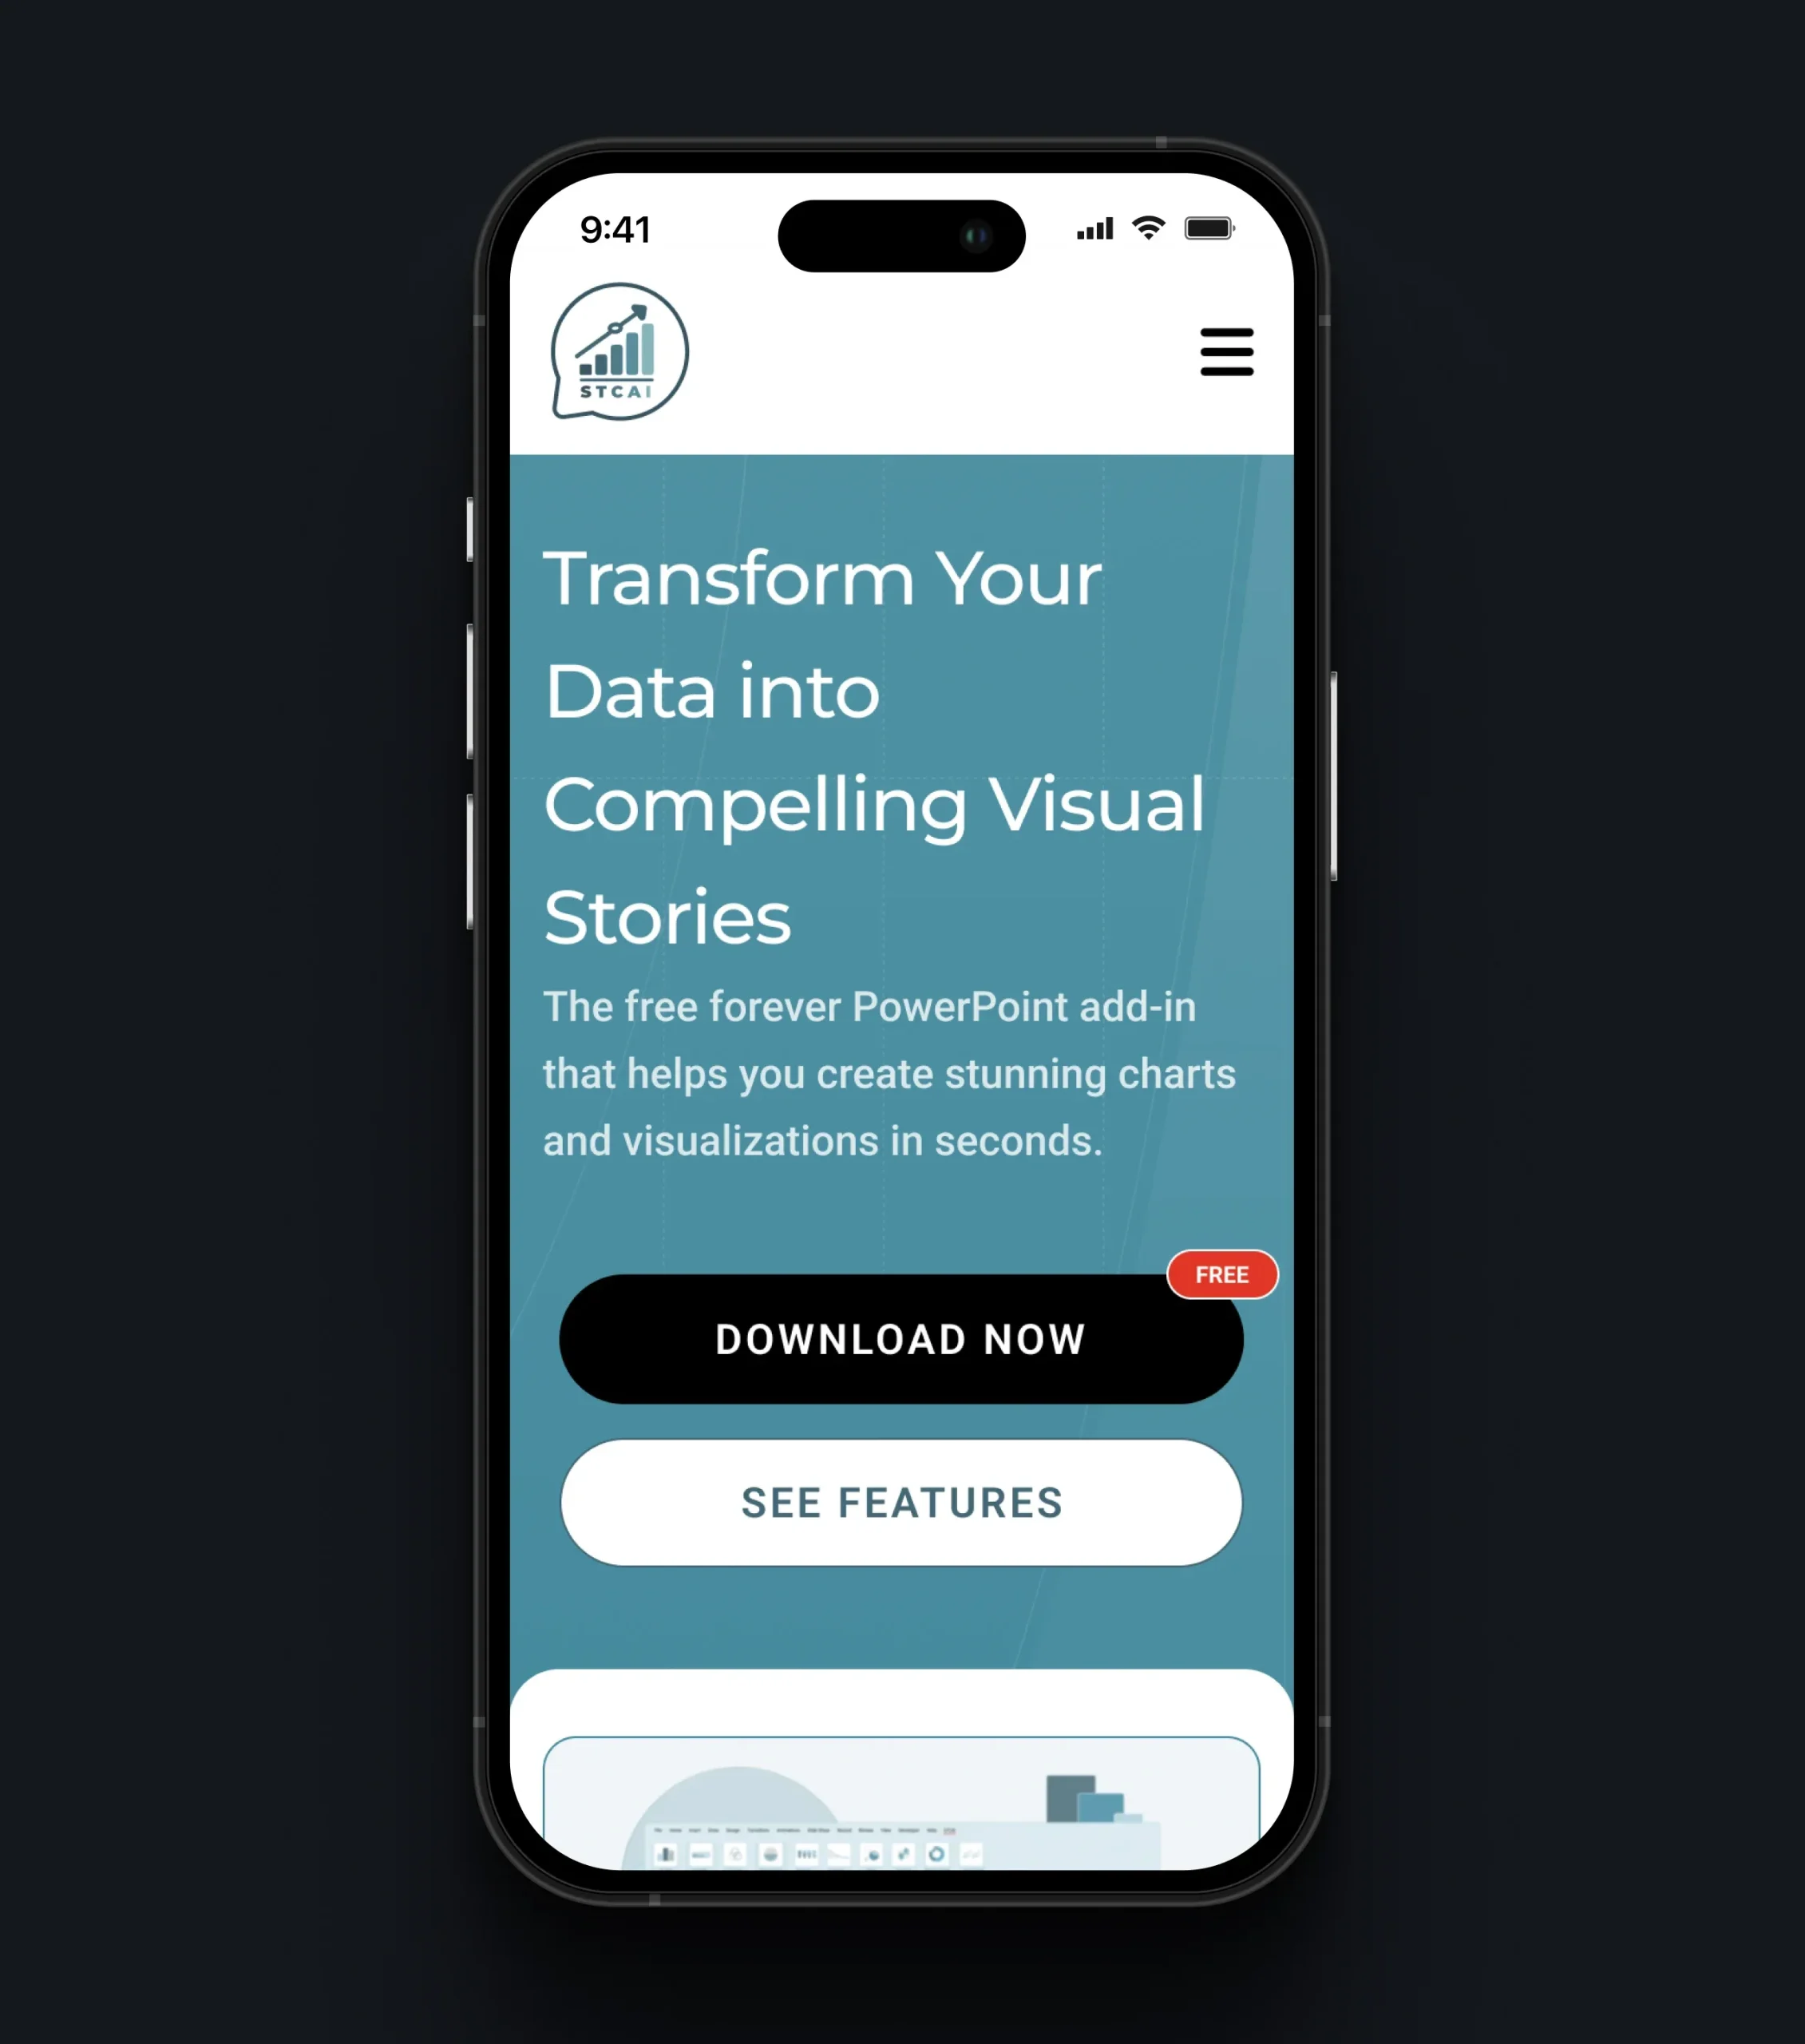
Responsive Mobile Experience
The mobile version carries the same clarity and visual rhythm as the desktop site, adapted for quick, on-the-go browsing. A thoughtful content hierarchy and compact navigation keep the product story easy to follow, so visitors can discover the plugin and take the next step from any device.

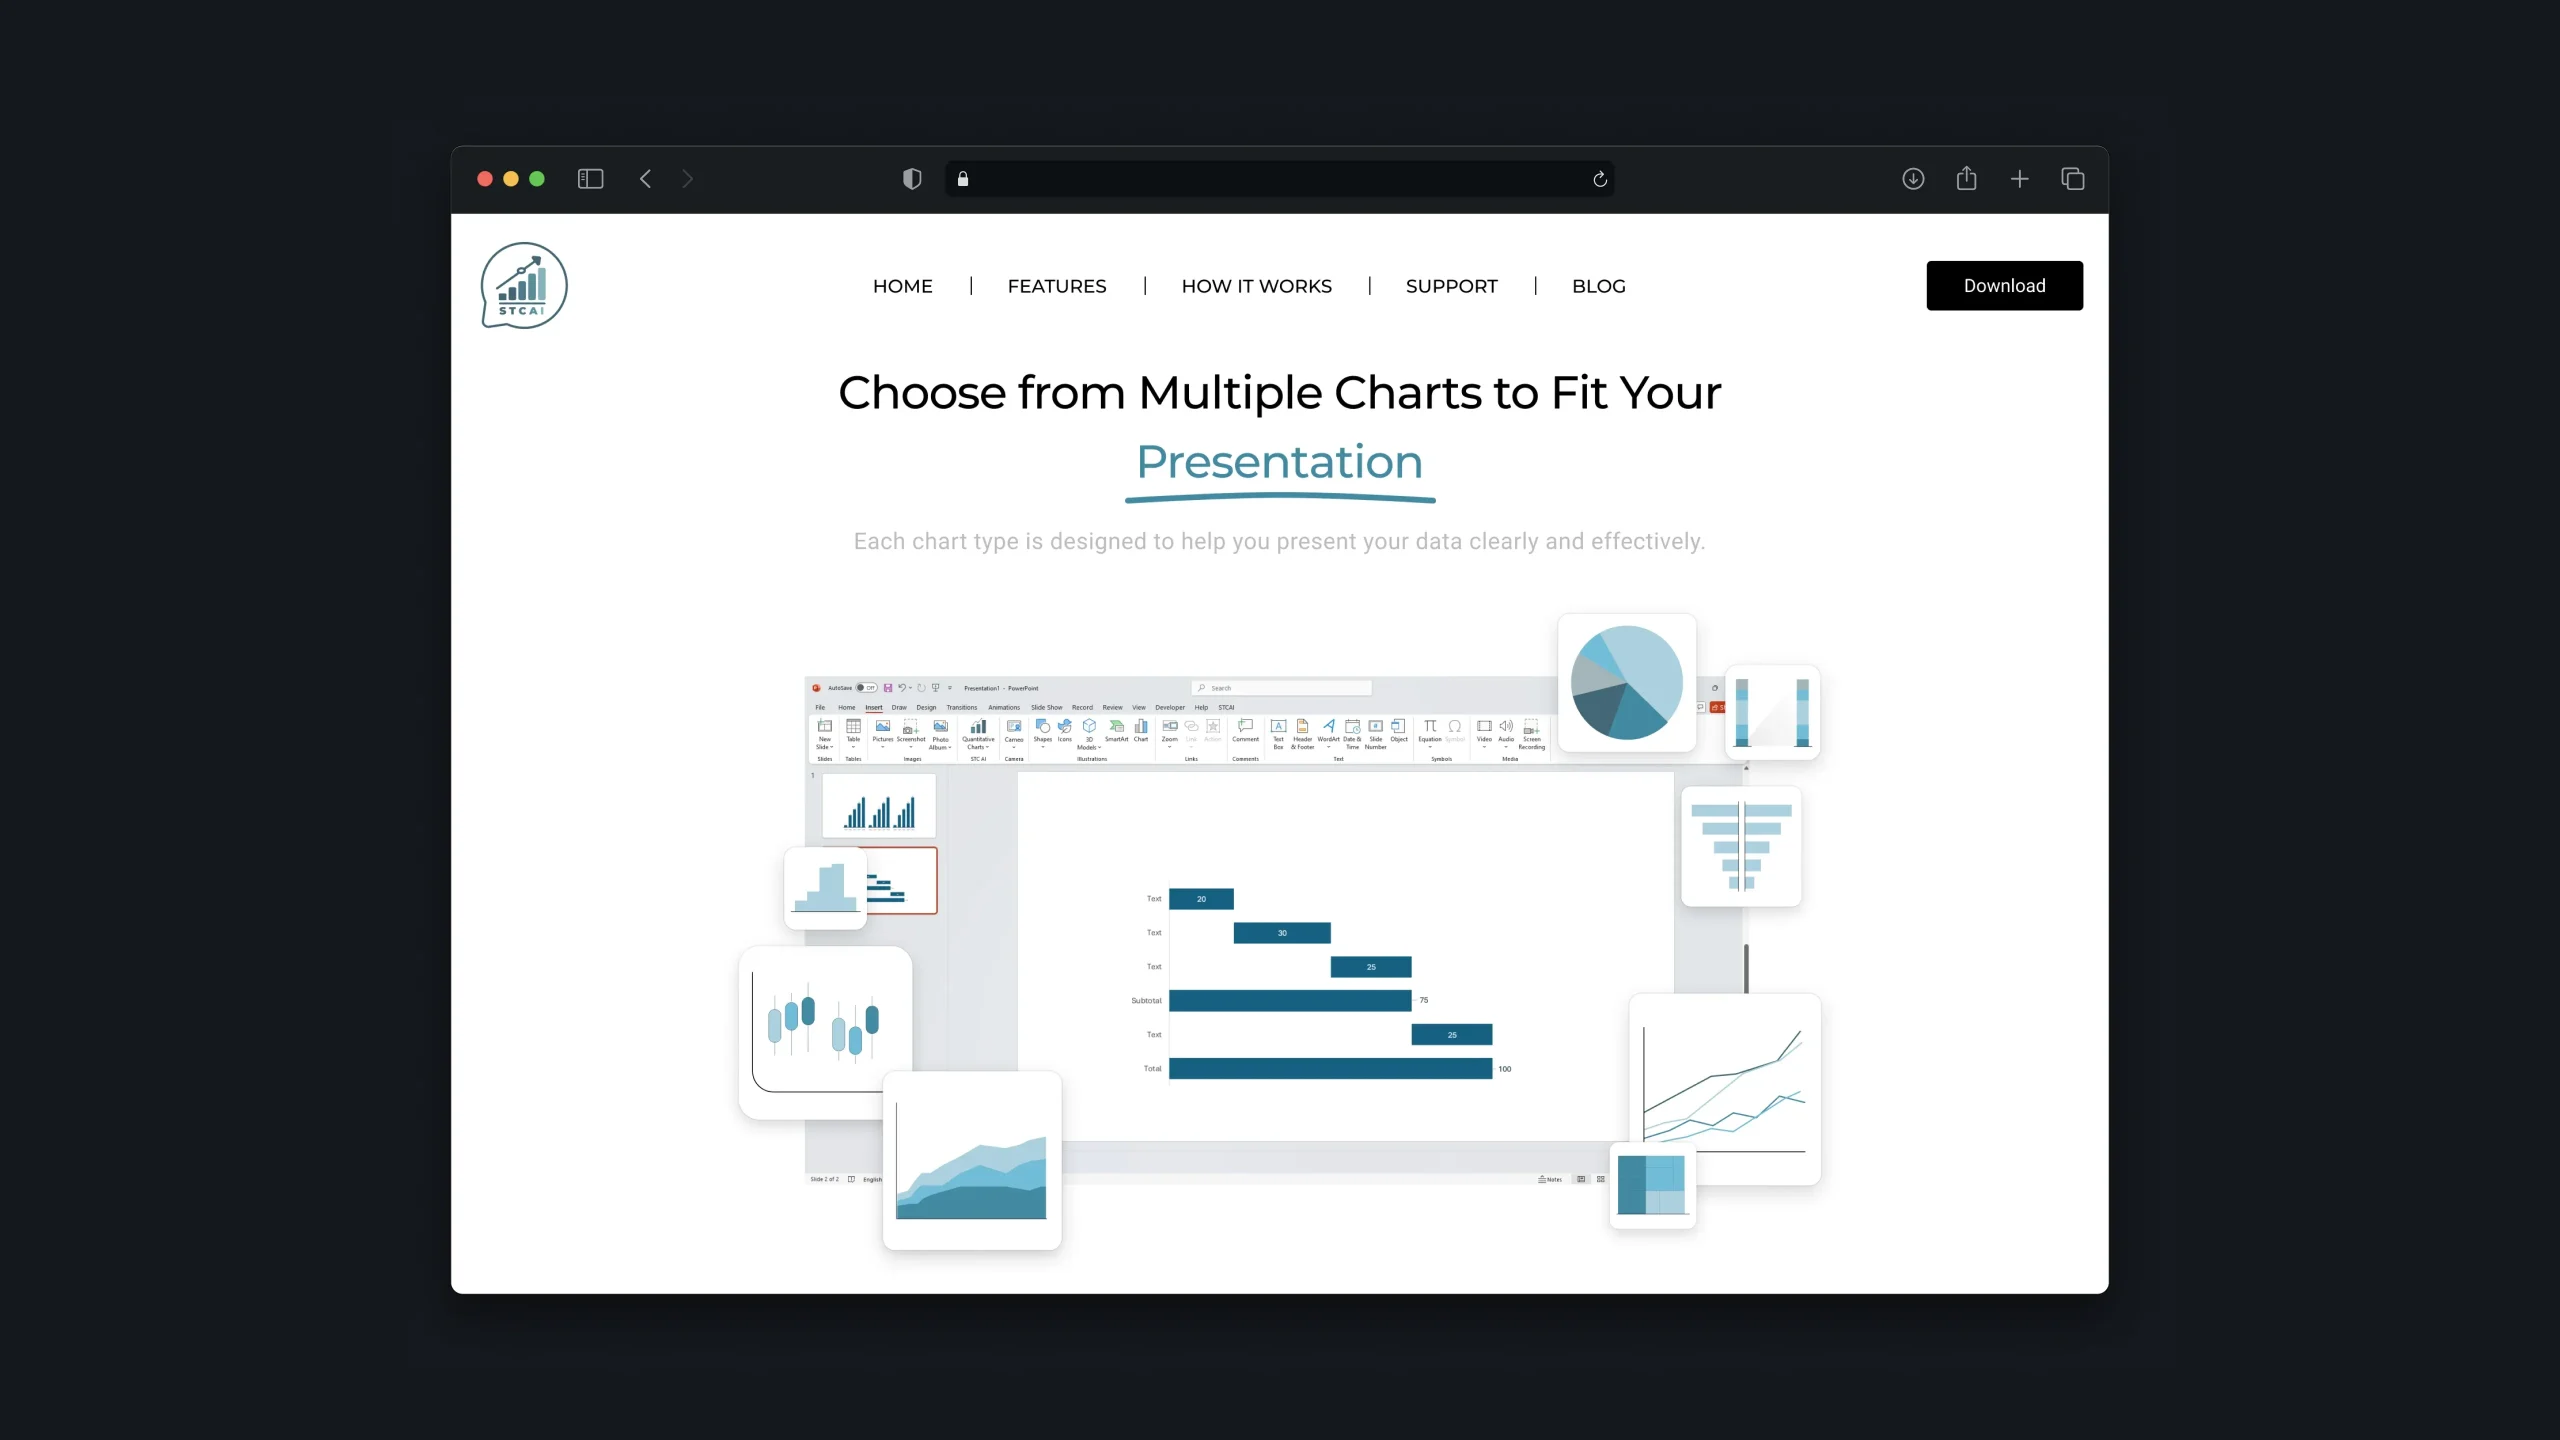
Charts Built Into PowerPoint
The plugin offers a wide range of chart types that help users transform complex data into clear, professional visualizations directly in PowerPoint. The website highlights these capabilities, showing how users can create and customize charts without switching between different tools.
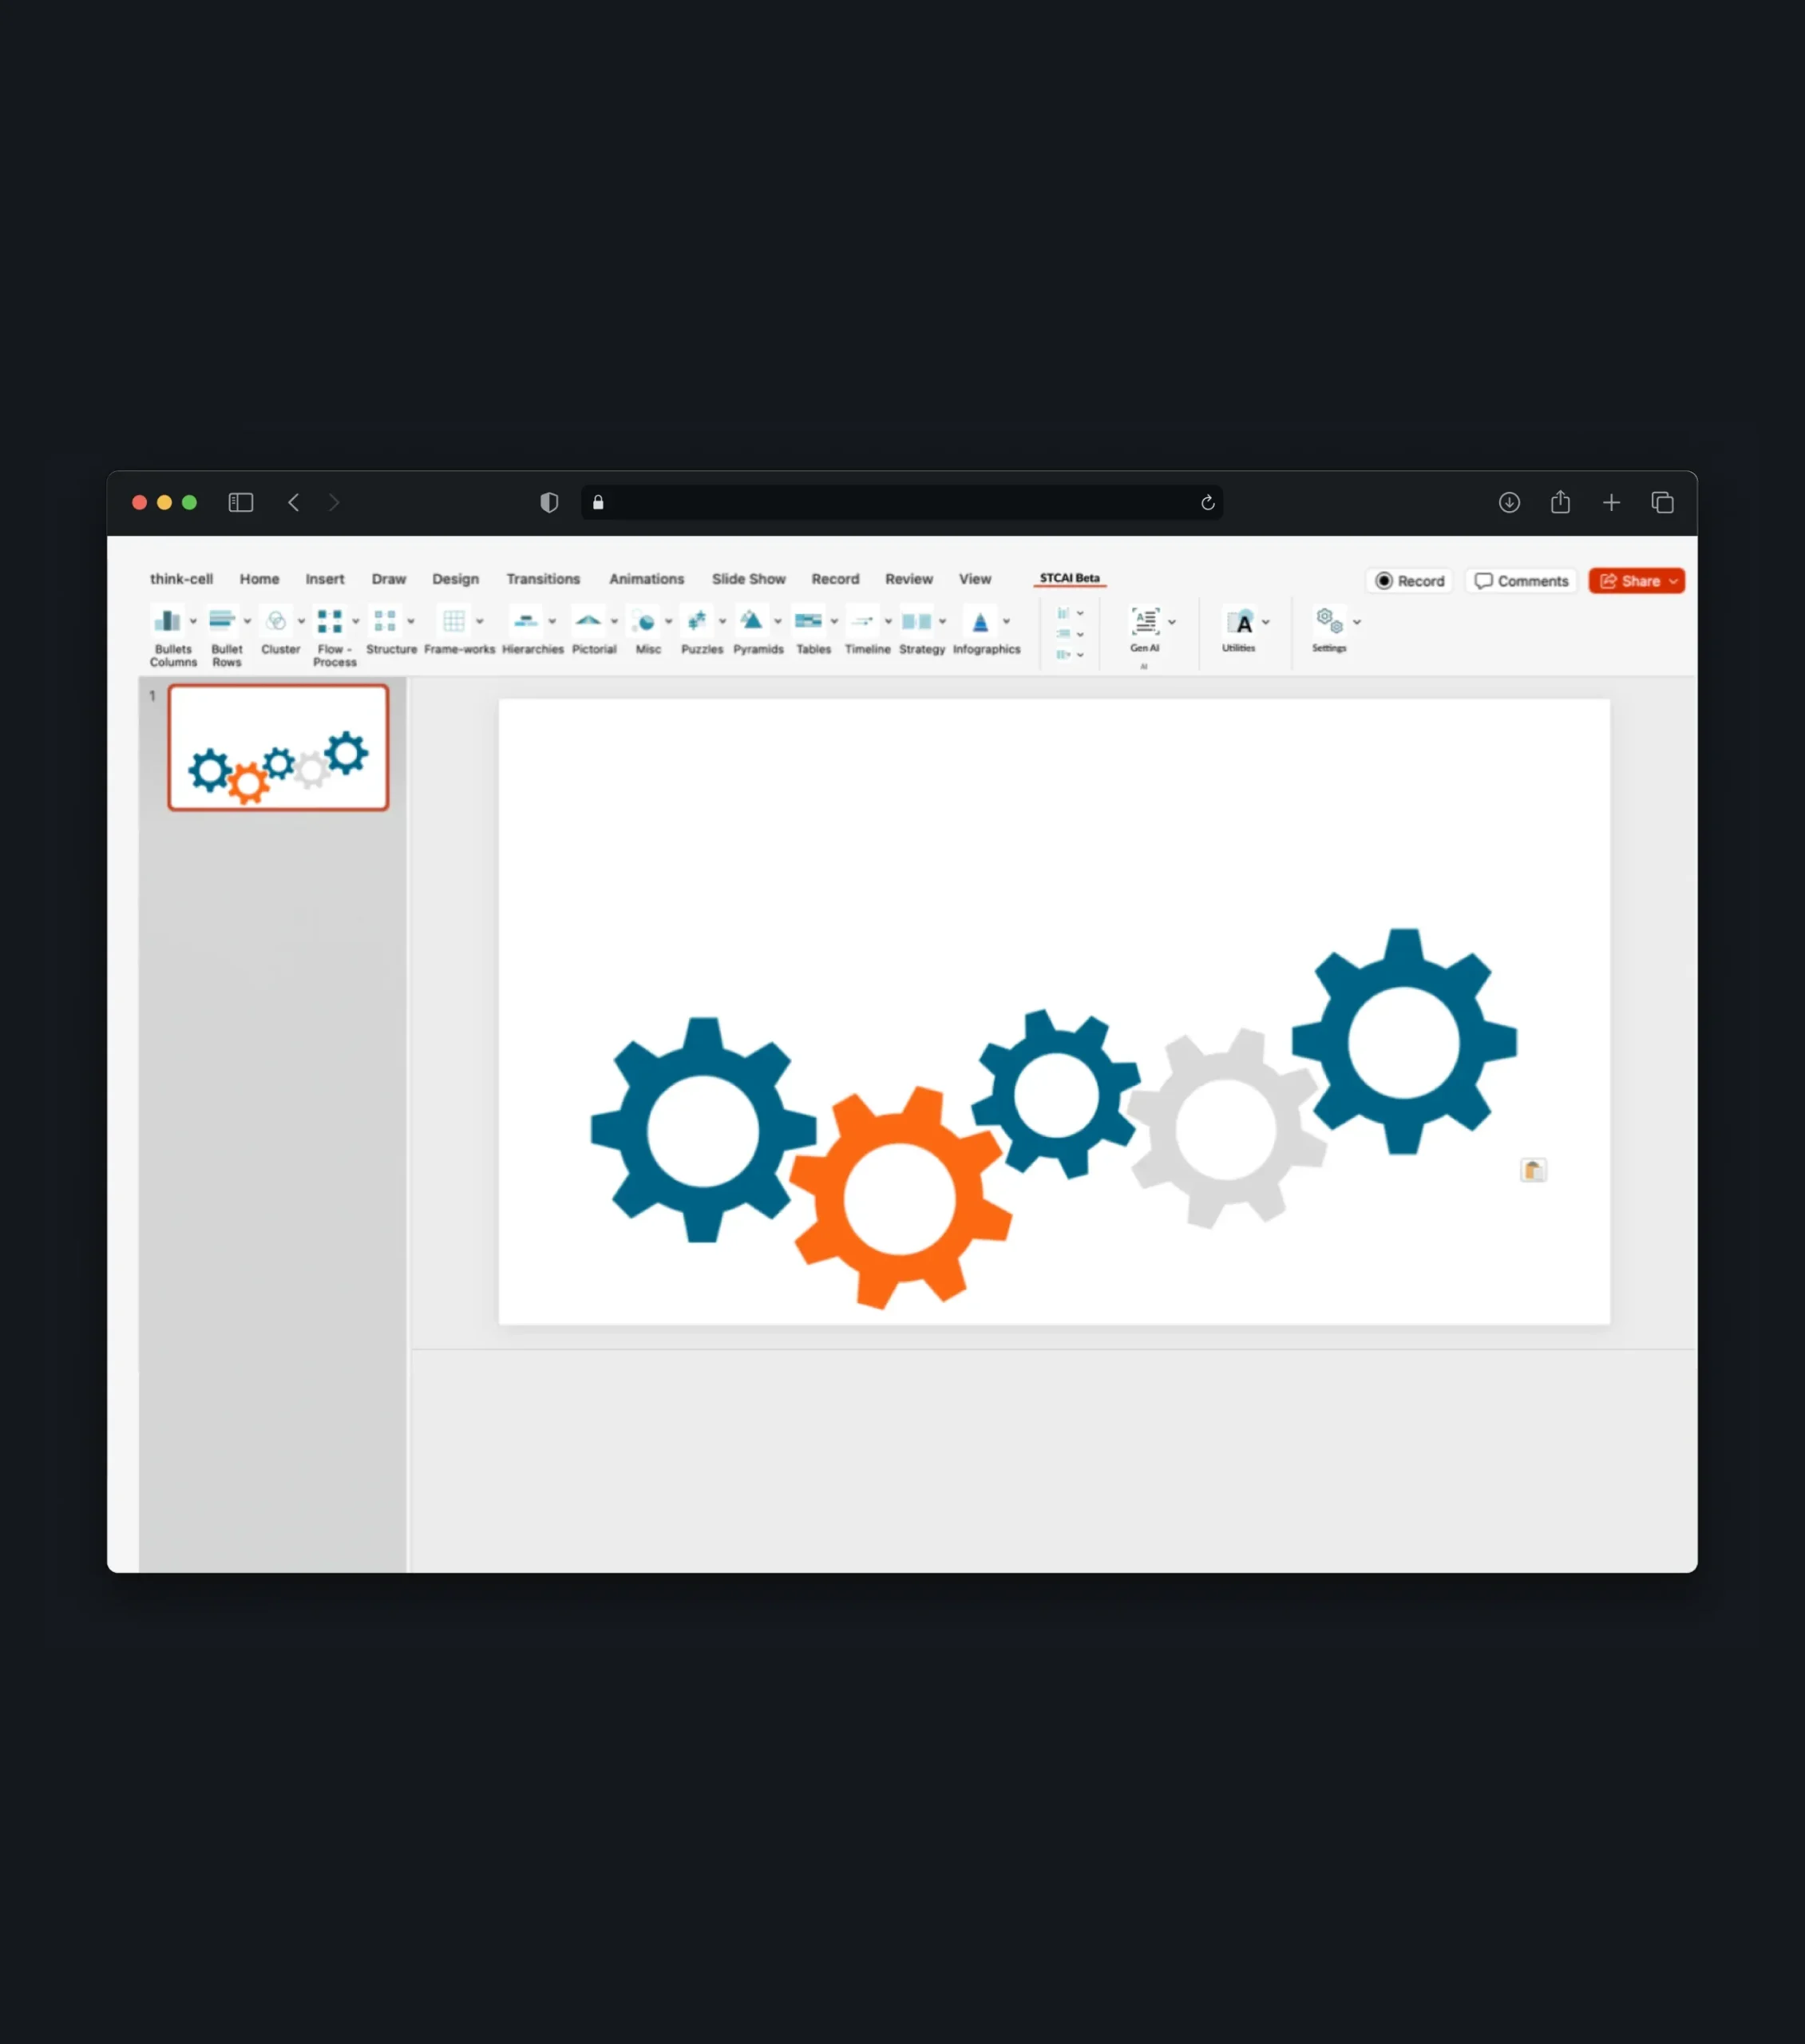
Visual Library & AI Storytelling
Beyond numbers, a structured library of diagrams helps users visualize concepts, processes, and strategies without drawing shapes from scratch. Built-in AI tools refine slide text in a single click, while logic features based on the author’s method help check that the whole deck tells one clear and consistent story.
Conclusion
The project brought together a website and a PowerPoint plugin into one cohesive product built around a proven approach to data storytelling. The design focused on making the product easy to discover, simple to get, and intuitive to use every day - from the first visit to a finished presentation.
A clear, value-focused home page, a guided path to free access, self-service support, and a responsive website work alongside a plugin that brings smart charts, a rich diagram library, and AI-powered storytelling tools directly into PowerPoint. The result is a connected experience that helps individuals and teams turn raw data into clear, compelling presentations with minimal effort.
More Cases




















































Your Next Step Starts Here
We don’t just analyze businesses - we uncover opportunities.